A data experience from AASR
Restrained and secluded: what the federal record shows
In a single school year, public schools reported holding, confining, and restraining tens of thousands of children. Every number here reads only from the federal record: the U.S. Department of Education, Office for Civil Rights, Civil Rights Data Collection.
These categories are reported separately. Do not add them together: one child can appear in more than one category.
Showing the 2021-22 collection. Use the year toggle above to switch between 2021-22 and 2020-21.
Exhibit A: The federal civil-rights record
Physically restrained
Secluded
Mechanically restrained
Restrained.
Secluded.
Not protected.
-
01
Scale of harm
-
02
It happened again and again
-
03
Children with disabilities are at the center
-
04
The sharpest racial disparity
-
05
The record is incomplete
What you can do
If you only have one minute, read this.
This is the plain-English version of the active year, 2021-22. The numbers are official federal counts, but they are still incomplete because schools self-report and many report nothing.
children were reported physically restrained. Schools also reported 28,712 children secluded and 8,219 mechanically restrained. Do not add these together, because one child can appear in more than one category.
of the children physically restrained were served under IDEA, even though IDEA students were about 14% of enrollment. This is the central disparity.
of children mechanically restrained were Black, compared with about 15% of enrollment. Mechanical restraint includes handcuffs used by police or school security.
of schools reported at least one student or event. These counts are floors, not ceilings. For this year, OCR did not suppress small cells, but non-reporting is still a major limit.
Scale field
How to read this record
The federal numbers are a doorway, not the whole room.
The Civil Rights Data Collection tells us where schools admitted restraint and seclusion happened. It does not show the child on the floor, the minutes behind a closed door, the parent reading an incident report, or the school that reported nothing at all.
That is why document-driven reporting matters. ProPublica Illinois and the Chicago Tribune paired federal data with public-records requests and incident reports in their investigation The Quiet Rooms, then explained how they reported the restraint story. This page follows the same records-first instinct at the national level: start with the official data, label its limits, and keep asking what the numbers hide.
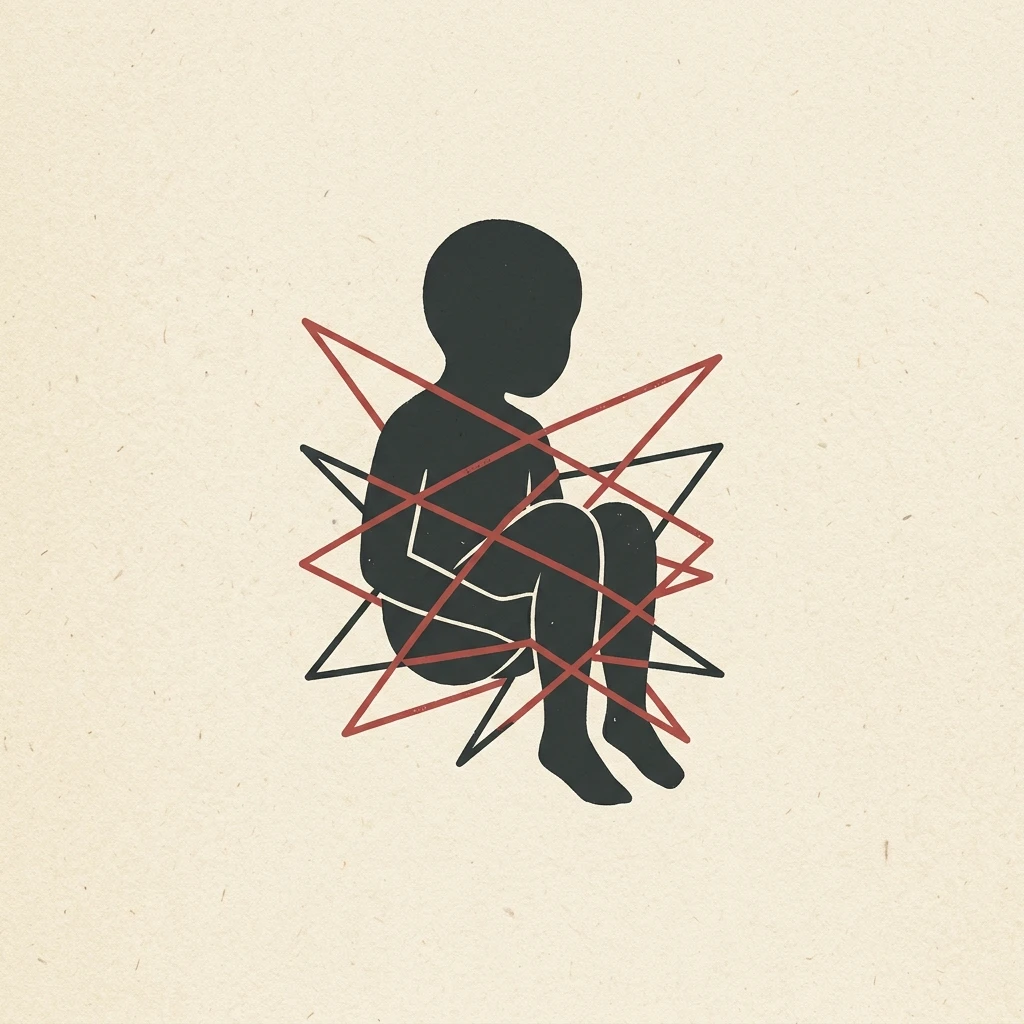
Physical restraint
Staff use bodily force to limit a child's movement. The federal file counts children and events separately.
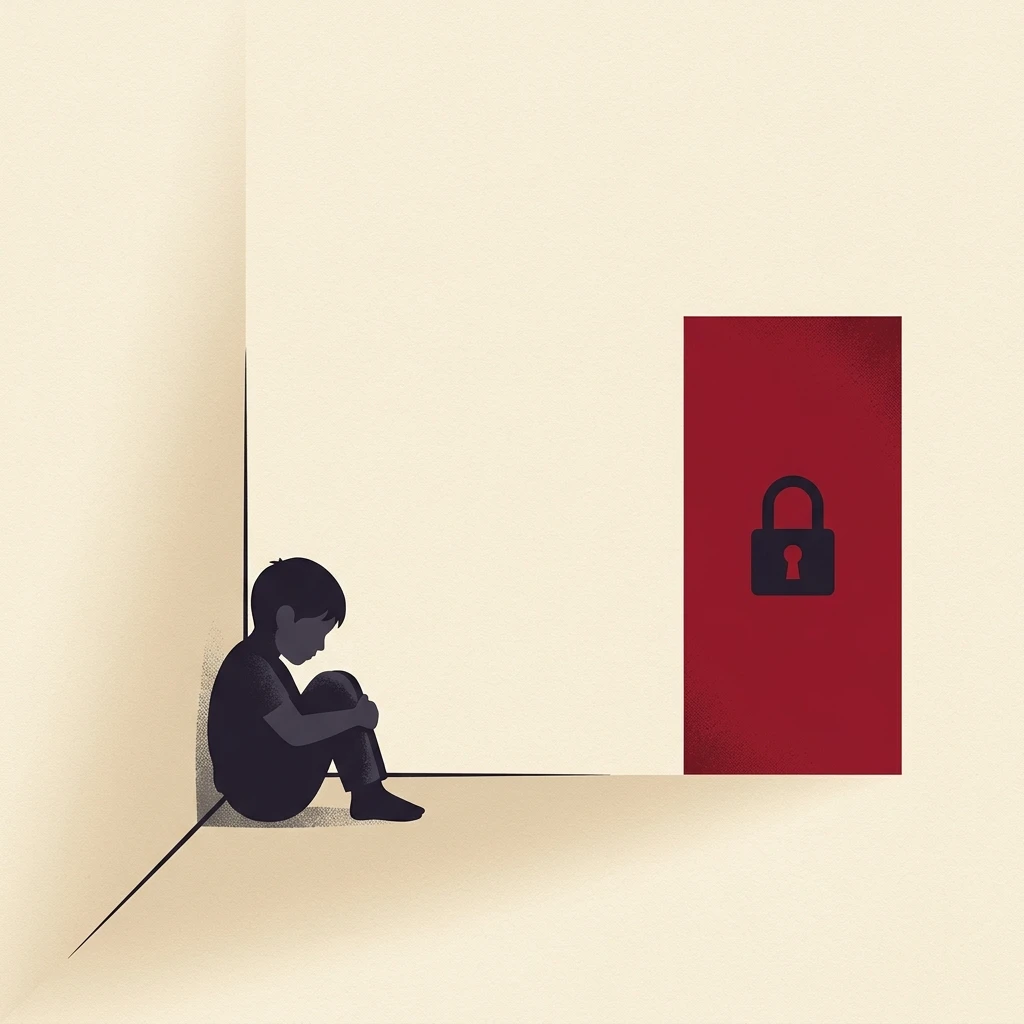
Seclusion
A child is alone in a room or area and is physically prevented from leaving. The record does not show how long it lasted.
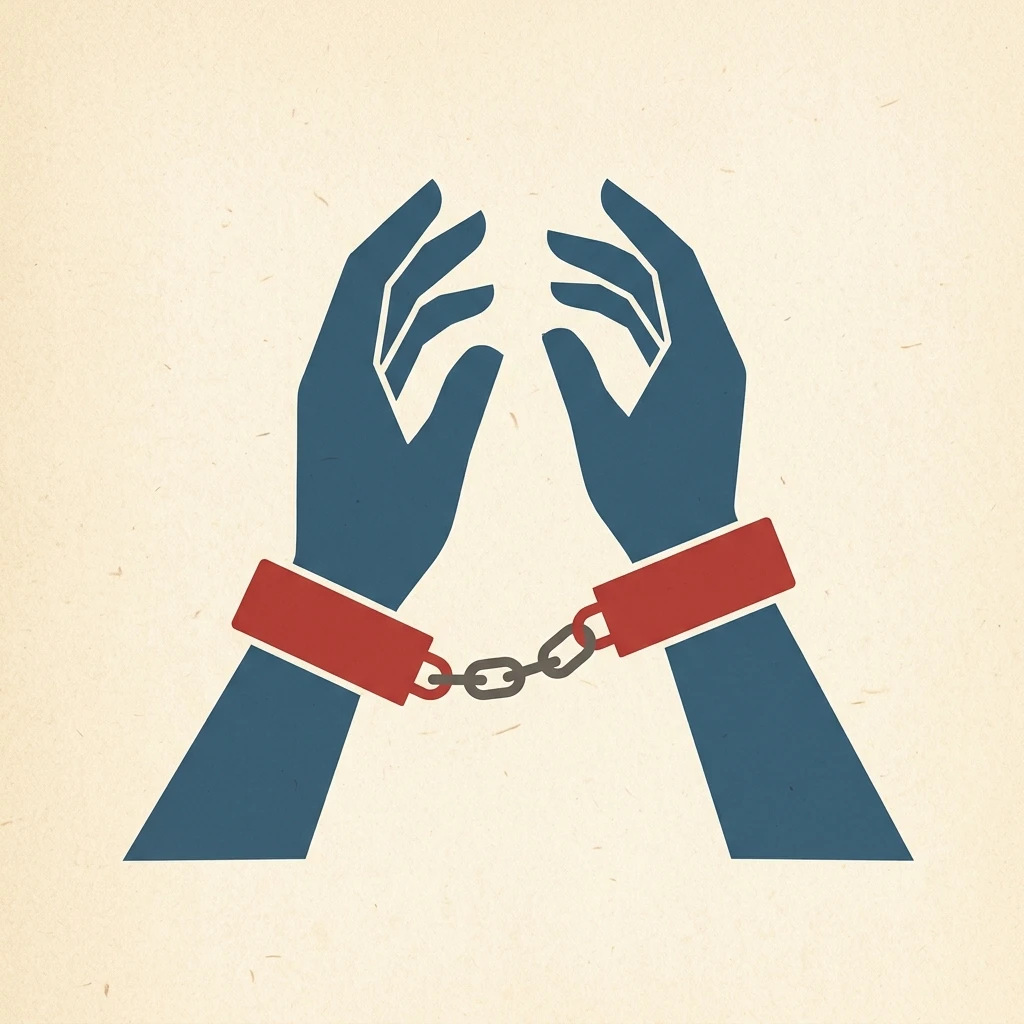
Mechanical restraint
Devices restrict movement. In this federal category, the count includes handcuffs used by police or school security.
Reporting context: ProPublica Illinois and the Chicago Tribune, The Quiet Rooms series. Data analysis here: U.S. Dept. of Education OCR, Civil Rights Data Collection.
Exhibit B: The scale in one school year
Three categories of physical control, each counting the children subjected to it. They are reported separately on purpose: a child held and also confined is counted once in each, so the three figures must never be added together.
Alliance Against Seclusion and Restraint. Source: U.S. Dept. of Education OCR, Civil Rights Data Collection.
Exhibit C: Repeated incidents, not one-time emergencies
The student counts are unique children. The event counts are far larger, because the same child is held or confined repeatedly. Across the year, restraint and seclusion are not single emergencies. They become routine.
Children subjected compared with events reported, by type
Exhibit D: Children with disabilities are overrepresented
This is the central finding. Students with disabilities are a small share of all students, but they are the overwhelming majority of children restrained and secluded. The gap is not subtle.
Share of enrollment compared with share of restraint and seclusion
Alliance Against Seclusion and Restraint. Source: U.S. Dept. of Education OCR, Civil Rights Data Collection. Baseline: OCR CRDC: A First Look.
Exhibit E: The racial disparity is sharpest in mechanical restraint
Black students as a share of each type, against their enrollment share
Alliance Against Seclusion and Restraint. Source: U.S. Dept. of Education OCR, Civil Rights Data Collection. Enrollment baseline: OCR CRDC: A First Look.
Exhibit F: Disability, race, and gender compound
Restraint and seclusion fall most heavily on boys, and most heavily of all on Black boys with disabilities. The categories compound.
Share who are boys, by type
Black children physically restrained, by disability status
Alliance Against Seclusion and Restraint. Source: U.S. Dept. of Education OCR, Civil Rights Data Collection.
Mechanical restraint happens in a few places, not everywhere
Share of all reported mechanical restraint, by state
Alliance Against Seclusion and Restraint. Source: U.S. Dept. of Education OCR, Civil Rights Data Collection. Mechanical restraint includes handcuffs and devices, often applied by law enforcement or school security.
All of it is somewhere. Find your state.
Search for a state, or sort the full list. Every state that reported any restraint or seclusion in the active year is here. These are raw reported counts of children, not per-capita rates.
Results update as you type and are announced below.
Sort by physical, seclusion, or mechanical
Compare reported counts
Select a state from the list, then compare it with another state.
Read this honestly. This file carries no enrollment denominator, so these are raw reported counts, not rates. Differences between states reflect reporting practice as much as real differences. A low count can mean a state restrains and secludes less, or that it reports less.
Alliance Against Seclusion and Restraint. Source: U.S. Dept. of Education OCR, Civil Rights Data Collection.
Exhibit G: The official file is incomplete
Reported and kept
Alliance Against Seclusion and Restraint. Source: U.S. Dept. of Education OCR, Civil Rights Data Collection, reserve codes.
How this compares over time
Set against the last pre-pandemic year, physical restraint and seclusion are roughly flat, while mechanical restraint has risen sharply. The pandemic year sits far below a normal year, and OCR cautions against comparing it with the others.
National student counts by type and collection year
Alliance Against Seclusion and Restraint. Source: U.S. Dept. of Education OCR, CRDC "A First Look" reports for 2017-18, 2020-21, and 2021-22.
Children's lives depend on what you do next.
Restraint and seclusion are largely preventable. Schools that invest in relationship-driven, trauma-informed practices, and that understand behavior as communication, reduce these events sharply and keep children and staff safer. What is counted here does not have to repeat.
See your stateJump back to the explorer
Tell Congress to pass the Keeping All Students Safe ActFind and contact your representative
Donate to the Alliance Against Seclusion and Restraintendseclusion.org/donate
The Keeping All Students Safe Act would set the first federal limits on restraint and seclusion in schools. Ask your representative to support it by name.
Source room: how the figures were computed
Every figure on this page is computed from the federal files and read from a single data object embedded in this page, so the story and the numbers cannot drift apart.
- Source
- Official validation
- How computed
- Sum only values of zero or greater. Negative cells are reserve codes, not counts, and are excluded. Section 504 students are a subset of the non-IDEA group, so students with disabilities equals IDEA plus 504. The three types are reported separately and never summed, because a child subjected to more than one type would be double counted.
- Coverage
- Corrections in the record
- One source labeled the larger download 2020-21, but its national totals matched the official 2021-22 collection to rounding, so it is reported here as 2021-22. The 2020-21 collection was built from the school file restraint and seclusion columns DS through EA, which are the nine event columns by type and disability group. The 2020-21 file also carries reserve code -11, suppressed data, which is disclosed in the section above and excluded from every total.
- Baselines
- Enrollment shares are from the OCR CRDC "A First Look" national reports, cited inline in the relevant sections.
- Reporting context
- The narrative framing draws on public-interest reporting practices exemplified by ProPublica Illinois and the Chicago Tribune's The Quiet Rooms series: pair official data with public records, explain what the data cannot show, and make the caveats visible.
- Data layer
- The figures rendered here are inlined in this page as JSON and also available as downloadable files beside this page: data-interactive/all-years.json (both years), data/ (2021-22 tables), and data-2020-21/ (2020-21 tables).
Data credit: U.S. Department of Education. This page was prepared as an independent data experience for the Alliance Against Seclusion and Restraint, in collaboration with Prior Signal. The 2020-21 collection covered a peak-remote pandemic year; OCR cautions against comparing 2021-22 with it, so any trend is anchored on the last pre-pandemic year, 2017-18.
Legal and data notice
This page is for public education, research, journalism, and advocacy. It is not legal, medical, clinical, financial, or other professional advice, and it does not create an attorney-client, solicitor-client, fiduciary, or professional relationship. For advice about a specific child, school, district, province, state, claim, complaint, or legal deadline, consult a qualified professional licensed in the relevant jurisdiction.
The figures are computed from public U.S. Department of Education Office for Civil Rights Civil Rights Data Collection files. They are provided as-is, without warranties of accuracy, completeness, fitness for a particular purpose, or non-infringement. CRDC data are reported by educational agencies, may contain errors or omissions, may exclude suppressed or reserve-coded cells, and should not be used as the only basis for legal, policy, clinical, disciplinary, or safety decisions.
This page is independent and is not endorsed by, sponsored by, or affiliated with the U.S. Department of Education, the Office for Civil Rights, the Government of Canada, any provincial or territorial government, or any school system. External links are provided for convenience. AASR and Prior Signal do not control third-party sites, donation processors, privacy practices, accessibility, security, or content.
This static page does not intentionally collect personal information from visitors. Standard hosting, browser, network, analytics, donation, email, or security systems operated by third parties may process technical information such as IP address, device, browser, referrer, and log data. Visitors in the United States, Canada, and elsewhere should review the privacy notices of any third-party service they choose to use, including donation and advocacy-action links.
Donations are made to the Alliance Against Seclusion and Restraint through its own donation page and processor. Nothing on this page is tax advice, a promise of deductibility, or a solicitation where prohibited. The collaboration with Prior Signal is disclosed on this page; no affiliate commission is paid for outbound public-resource links unless expressly stated.